Knoxville & East Tennessee Housing Market Update: October 2026
If you have been wondering whether homes are still selling in Knoxville and East Tennessee, the latest local numbers offer some perspective. Home sales picked up in September, buyers had more options, and pricing continued to make a difference.
The October Market Pulse report from East Tennessee REALTORS® looks at September 2026 sales. Here is what those numbers mean if you are thinking about buying or selling a home.
Home Sales Picked Up After a Slower August
East Tennessee home sales increased 10.9% compared with September 2025, bringing year-to-date sales growth to 7.2%.
In everyday terms, more homes are selling than last year, even though the market can feel slower from week to week. Pending sales—homes that have accepted an offer but have not closed yet—were also up about 4% compared with a year earlier.
That is a helpful reminder that national housing headlines do not always tell the full story here in East Tennessee. Local activity can look different depending on the neighborhood, price range, and type of home.
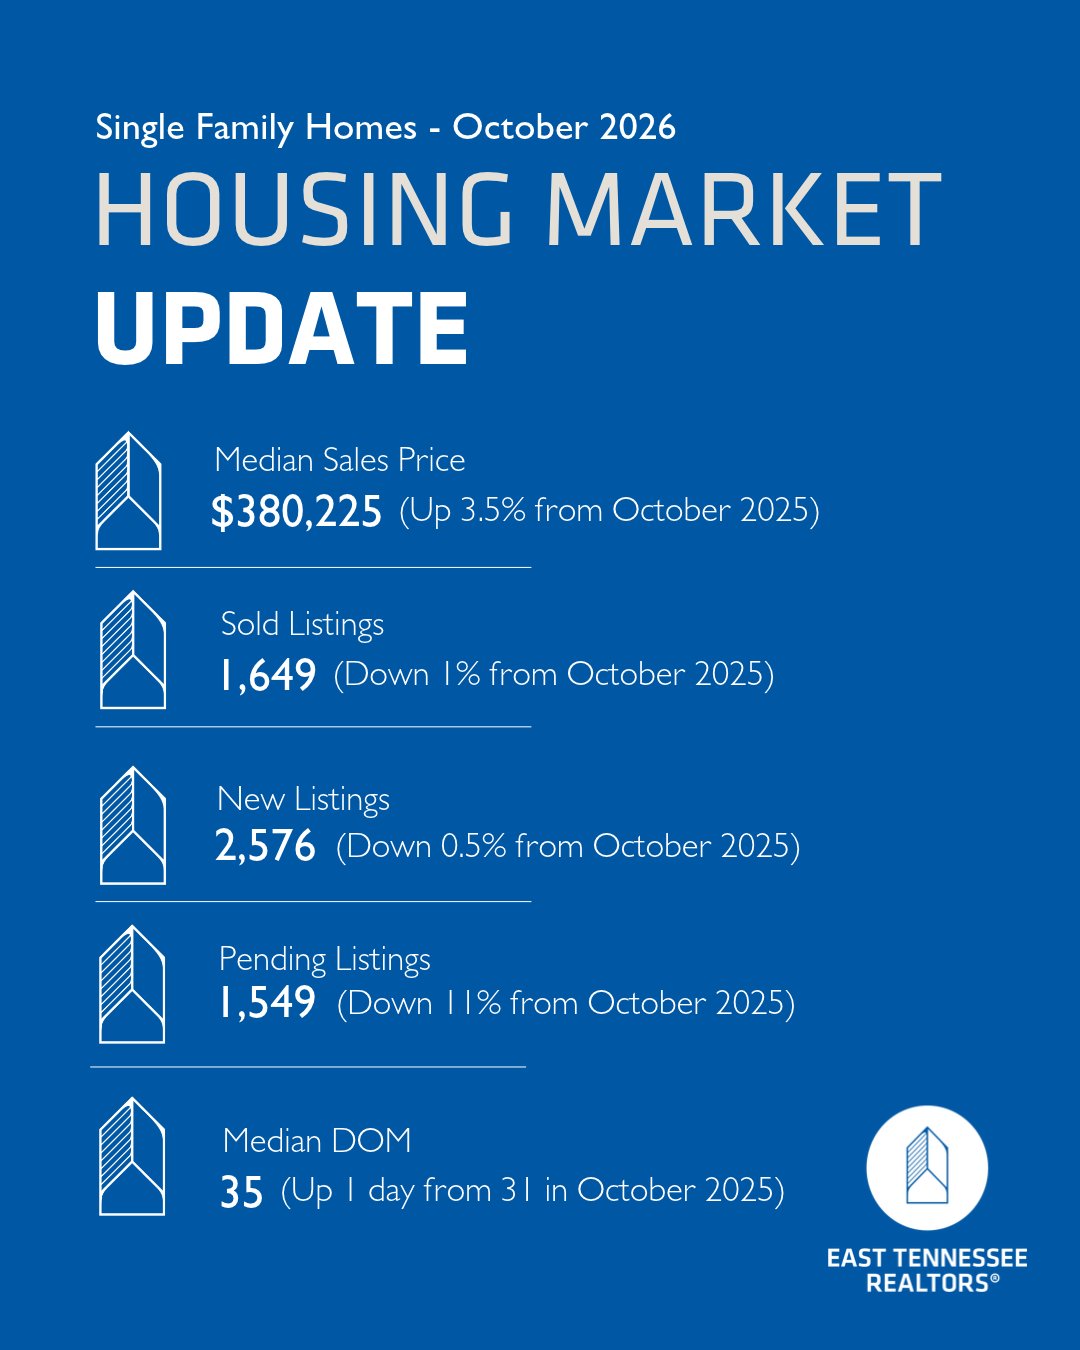
The Median Home Price Was $375,000
September’s median sale price was $375,000, down 1.3% from last year.
The median is the middle price: half of the homes sold for more, and half sold for less.
This does not mean every home in Knoxville lost 1.3% of its value. The median also changes depending on which homes sell during a particular month. A month with more sales at lower price points can bring the median down.
For homeowners, recent sales of similar properties nearby are more useful for estimating value than the regional median alone.
Buyers Had More Homes to Choose From
The number of homes available for sale increased 7.5% compared with September 2025.
For buyers, that means more choices and potentially more room to compare properties before making a decision. For sellers, it means your home may be competing with more listings.
Pricing, condition, presentation, and marketing all matter when buyers have options.
How Quickly Are Homes Selling?
Half of the homes that sold went under contract in 32 days or less, just one day longer than a year earlier.
That does not mean every home will sell in about a month. Some move quickly, while others take longer depending on price, location, condition, and buyer demand.
If your home does not receive an offer during its first weekend, that alone does not mean something is wrong. But showing activity and buyer feedback can help determine whether an adjustment is needed.
Are Sellers Still Getting Their Asking Price?
In September:
- 36.8% of homes sold at or above asking price.
- 16.4% sold above asking price.
- 6.7% sold for at least $10,000 over asking.
- 2.2% sold for at least $25,000 over asking.
The overall sale-to-list price ratio was 98.4%. To put that into perspective, 98.4% of a $400,000 asking price is $393,600.
That is an illustration, rather than a prediction for a particular home. It also does not account for repairs, closing-cost assistance, or other negotiated terms.
The takeaway? Some homes still attract competing offers, while others require negotiation.
Your Price Range Makes a Difference
The market is not moving at the same pace for every home.
Homes priced under $350,000 made up nearly 45% of September sales. These properties averaged 31 days on the market and sold for approximately 98.4% of asking price.
Homes priced above $1 million made up 4.6% of sales. These properties averaged 45 days on the market and sold for approximately 95.6% of asking price.
For luxury sellers, these numbers reinforce the importance of thoughtful pricing and allowing time to reach the right buyer. For buyers, they show why negotiating opportunities can vary by price range.
New Construction Made Up a Smaller Share of Sales
New construction accounted for 9.6% of September home sales, compared with 14% a year earlier—the lowest monthly share since 2022.
This means newly built homes represented a smaller portion of completed sales. It does not necessarily mean builders stopped building or that every community experienced the same slowdown.
If you are considering new construction, compare the full package: purchase price, available incentives, upgrades, financing terms, and completion timeline.
What Does This Mean for Your Next Move?
For buyers: More inventory gives you more options, but desirable, well-priced homes can still attract competition. Focus on your budget, priorities, and comparable sales when deciding what to offer.
For sellers: Homes are selling, but success takes preparation and realistic expectations. Strong presentation, consistent marketing, and a price supported by nearby sales can help your home stand out.
As we head toward winter, the September numbers show continued growth in East Tennessee sales. What happens next will depend on factors including interest rates, available inventory, and buyer demand.
Thinking about buying or selling in Knoxville, Farragut, Hardin Valley, or the surrounding East Tennessee area? We would love to help you understand what is happening in your specific neighborhood and price range so you can make a confident decision.
Source: East Tennessee REALTORS® October 2026 Market Pulse, reporting September 2026 data. Reported home sales growth uses a seasonally adjusted measure, which accounts for typical seasonal changes to make comparisons more useful.