Knoxville & East Tennessee Housing Market Update: October 2026
Home prices increased, closed sales stayed close to last year’s pace, and fewer homes went under contract. That combination makes October’s East Tennessee housing market worth a closer look.
For buyers and sellers in Knoxville, Farragut, Hardin Valley, Maryville, and the surrounding communities, the takeaway is that pricing and preparation still matter. A higher regional median price does not mean every seller can ask more, and slower contract activity does not mean every buyer will find a deep discount.
Here is what the October 2026 single-family housing report from East Tennessee REALTORS® tells us—and how to put those numbers into perspective.
October 2026 East Tennessee Housing Market Statistics
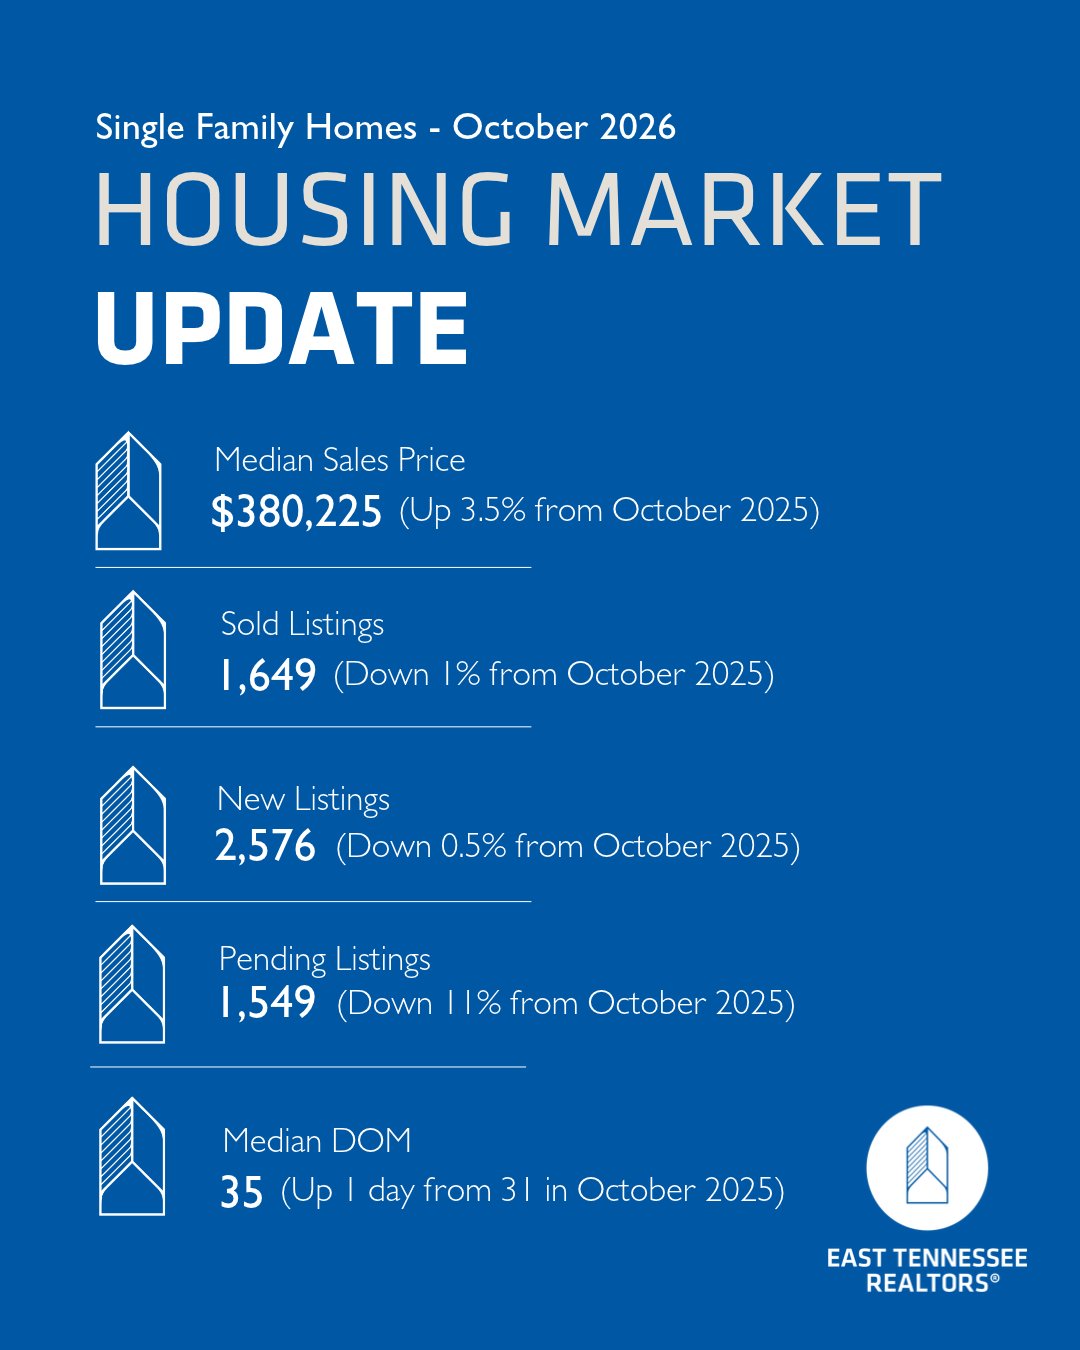
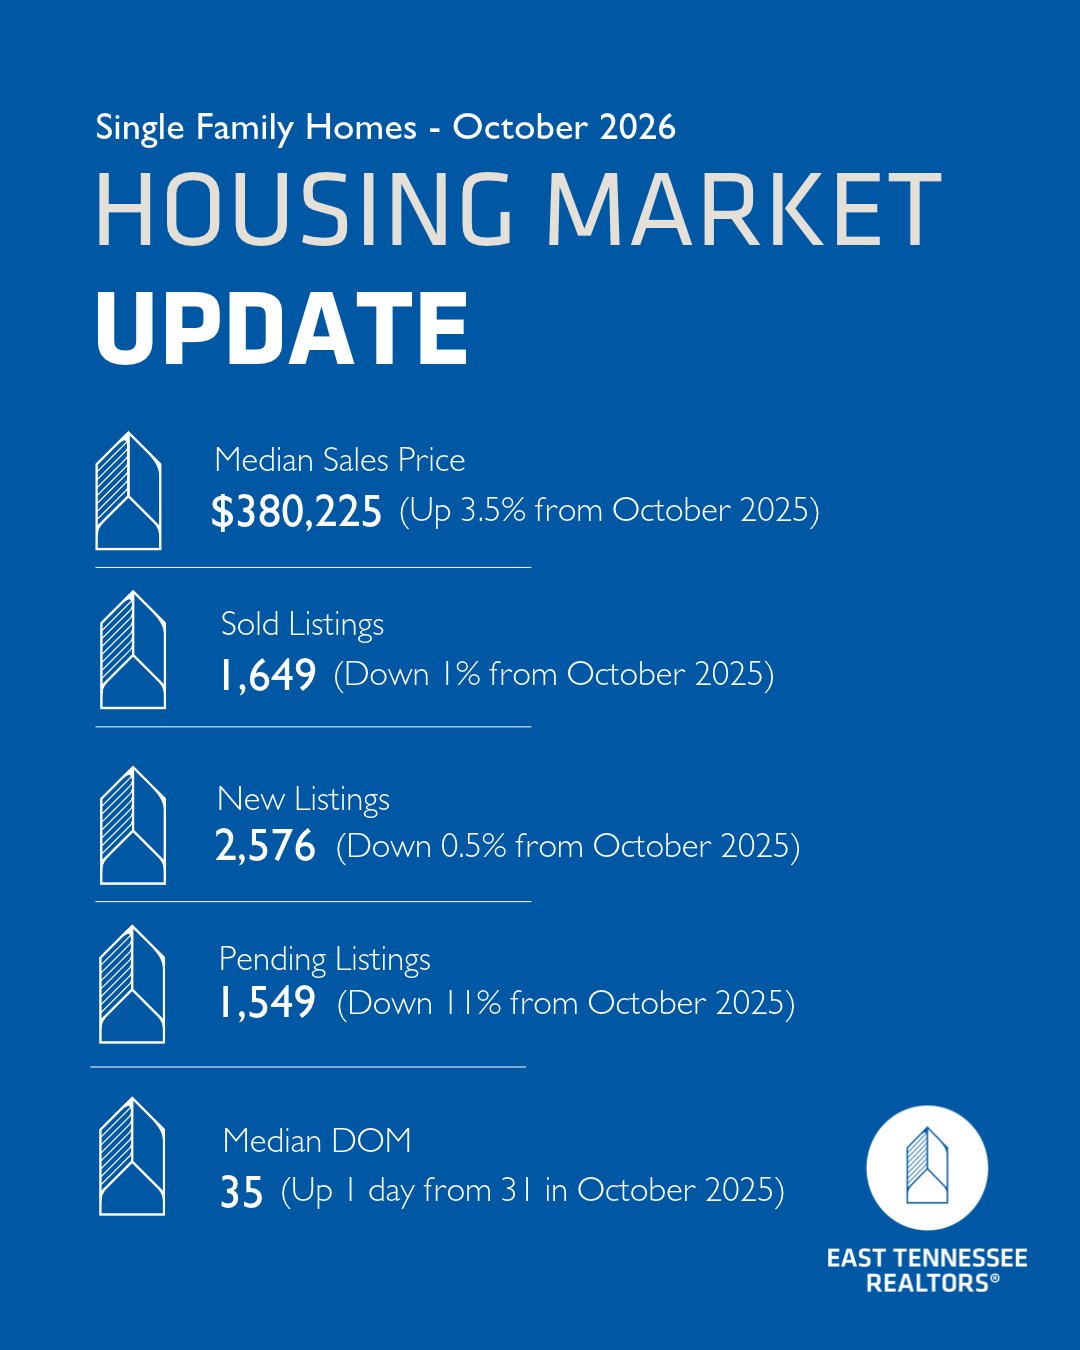
Market indicator | October 2026 | Change from October 2025 |
|---|---|---|
Median sales price | $380,225 | Up 3.5% |
Sold listings | 1,649 | Down 1% |
New listings | 2,576 | Down 0.5% |
Pending listings | 1,549 | Down 11% |
Median days on market | 35 days | See source note below |
Source: East Tennessee REALTORS® October 2026 single-family housing market graphic. These are regional figures, rather than statistics specifically for Knoxville or any individual neighborhood.
Home Prices Rose, but That Does Not Tell the Whole Story
The median sales price reached $380,225, up 3.5% compared with October 2025.
This means the midpoint price of homes sold was higher than a year earlier. It does not mean every East Tennessee home gained 3.5% in value. The median can also change depending on the mix of homes sold, including their locations, sizes, and price ranges.
For sellers, the practical takeaway is to look beyond the headline. Your home’s pricing should reflect recent comparable sales, its condition, and the properties buyers can choose from today.
For buyers, rising median prices are a reminder that softer sales activity does not automatically translate into falling prices. The value of a particular home still needs to be evaluated on its own merits.
Closed Sales Were Nearly Even With Last Year
There were 1,649 sold listings in October, a 1% decrease year over year.
That is a relatively small change. Buyers continued to complete purchases at a pace close to the same month last year.
However, closed sales generally reflect decisions made earlier in the transaction process. They tell us what successfully reached the closing table, while pending activity offers another perspective on more recent buyer decisions.
That distinction matters this month because the change in pending listings was considerably larger.
Pending Listings Fell 11%: A Number to Watch
October recorded 1,549 pending listings, down 11% from October 2025.
The decline suggests softer contract activity compared with a year earlier. If that pattern continues, it could affect closed sales in the following months. One month alone, however, does not establish a lasting trend or tell us exactly why activity changed.
For sellers, this supports taking a thoughtful approach from the beginning. Buyers need a clear reason to choose your home over competing properties. Accurate pricing, strong photography, attractive presentation, and convenient showing access all help communicate its value.
For buyers, softer contract activity may create negotiating opportunities on some properties. Those opportunities will depend on the home’s competition, time on the market, condition, and the seller’s circumstances.
New Listings Changed Very Little
2,576 new listings entered the market in October, down just 0.5% year over year.
The number of homes newly offered for sale was essentially steady compared with October 2025. Combined with lower pending activity, that is a reason to pay attention to how quickly new listings are attracting buyers.
However, new listings are different from total available inventory. This graphic does not include active inventory or months of supply, so these figures alone cannot establish whether East Tennessee is a buyer’s market or a seller’s market.
For an individual move, the more useful question is: How much competition exists in your location and price range?
A buyer looking for a one-level home in Farragut may face a different set of choices than someone searching for a downtown Knoxville condo or a larger property in Maryville.
What Does a Median of 35 Days on Market Mean?
The report lists 35 median days on market.
A median is the midpoint of the reported results—not a deadline for your home or a promise that a buyer has five weeks to decide.
Some properties will move more quickly, while others will take longer. Price, location, condition, layout, and competition can all influence that timeline.
For sellers, this number helps set expectations. Listing a home should come with a plan for evaluating showing activity, buyer feedback, and competing listings as the process unfolds.
For buyers, a home that has been available longer may be worth revisiting. The key is understanding why it has not sold and whether its current price reflects its condition and comparable sales.
What This Means if You Are Selling a Home in Knoxville
My takeaway for sellers is straightforward: enter the market with a clear pricing and marketing strategy.
The increase in the regional median price is encouraging, but the decline in pending listings reinforces the importance of earning buyers’ attention.
Before listing, I recommend focusing on:
- Relevant comparable sales: Use homes that closely match your location, size, condition, and features.
- Current competition: Understand what buyers can purchase at a similar price today.
- Presentation: Address visible maintenance concerns and prepare the home for photography and showings.
- Consistent marketing: Make sure buyers understand the property’s strongest features.
- Timely adjustments: Review feedback and activity so decisions are based on evidence.
A successful sale starts with understanding where your home fits in its specific market.
What This Means if You Are Buying a Home in East Tennessee
For buyers, October’s numbers support a careful, property-specific approach.
There may be room to negotiate on certain homes, but the regional report does not tell us how much any particular seller will accept.
Before making an offer, consider recent comparable sales, the home’s condition, its listing history, and the number of similar properties available. Depending on the circumstances, negotiations might involve price, repairs, closing costs, or timing.
The goal is to identify a home that fits your needs and negotiate terms supported by the property and the market around it.
Planning a Move in Knoxville, Farragut, Hardin Valley, or Maryville?
October’s report shows higher median prices alongside nearly steady closed sales and weaker pending activity. Those trends provide useful context, but your neighborhood and price range deserve a closer look.
Whether you are preparing to sell, buying your first home, or relocating to East Tennessee, I would love to help you understand what these numbers mean for your plans!